Stochastic Time-Depth Conversion with Petrosys PRO and Isatis.neo

Unlocking reliable subsurface insights requires more than a single “best guess.” In collaboration with Geovariances, we demonstrate how combining Petrosys PRO and Isatis.neo creates a powerful workflow for stochastic time-depth conversion and probabilistic volumetrics.

PRO is trusted worldwide for seismic mapping, faulted surface modelling, and integration with interpretation projects, making it the ideal platform to prepare high-quality time surfaces.

Isatis.neo, developed by Geovariances, is a leading geostatistics software solution designed to quantify uncertainty, generate multiple realizations, and deliver probabilistic insights into subsurface geometry and reservoir potential.

By integrating these tools, exploration teams can quantify uncertainty in depth conversion, generate probabilistic gross rock volume (GRV) estimates, and make smarter, risk-aware exploration decisions.

PRO Stochastic Time Depth Map


Stochastic Time-Depth Conversion with Petrosys PRO and Isatis.neo

Abstract

Subsurface interpretation and volumetric assessment are often limited by deterministic workflows that provide only a single “best estimate” of depth and gross rock volume. This underrepresents the true geological uncertainty inherent in seismic interpretation, sparse well control, and velocity modelling.

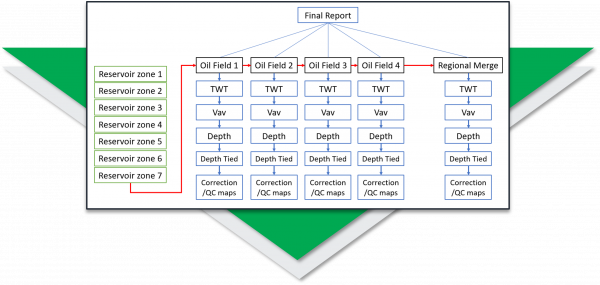
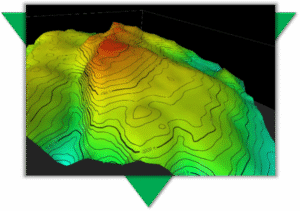
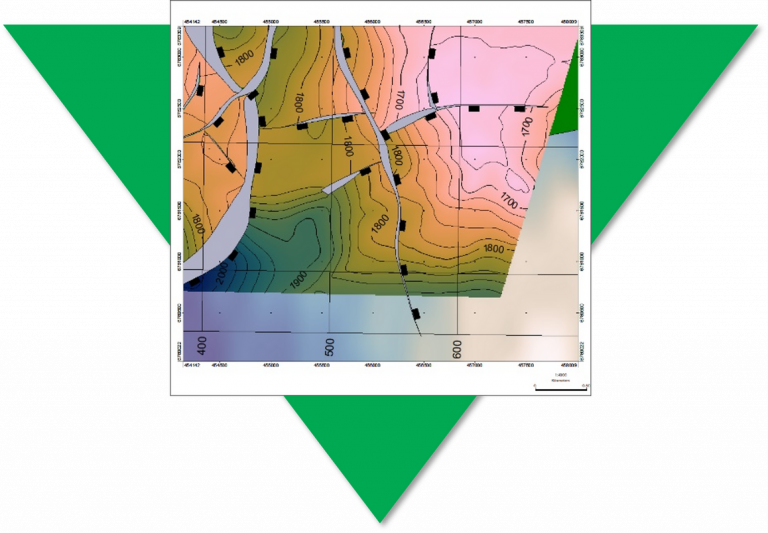
In this study we present a workflow that integrates Petrosys PRO and Isatis.neo to deliver a more robust and risk-aware approach to time–depth conversion and volumetric analysis. Petrosys PRO is used to construct and refine complex faulted time surfaces directly from seismic interpretation projects. These QC’d and validated time grids form the foundation for subsequent stochastic modelling.

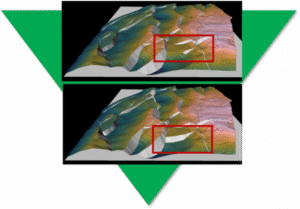
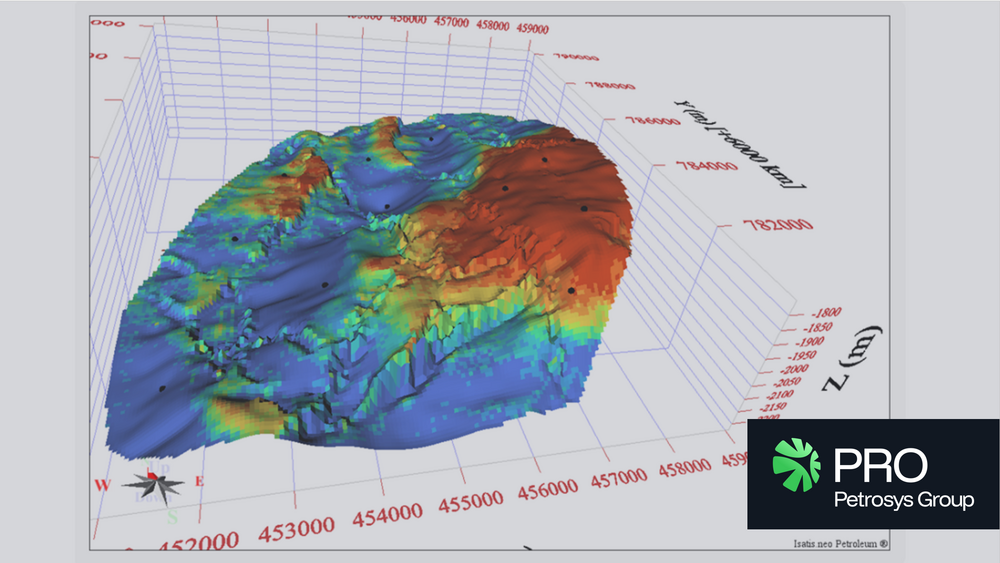
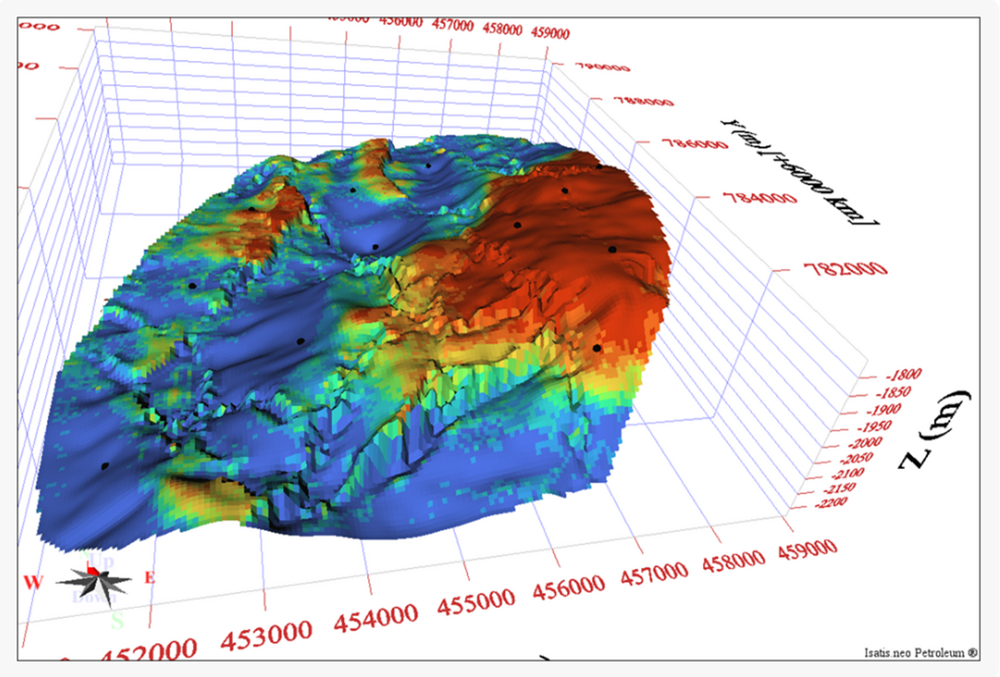
The workflow then applies geostatistical methods in Isatis.neo, specifically Bayesian kriging with external drift and multiple realizations, to condition depth horizons exactly to well markers while honouring seismic time data as continuous auxiliary information. This process quantifies and propagates uncertainty from velocity model parameters and spatial variability into multiple stochastic depth scenarios. For each realization, reservoir spill-points and gross rock volumes are calculated, producing probabilistic GRV distributions instead of single deterministic numbers.

By combining Petrosys PRO for surface building with Isatis.neo for stochastic geostatistical modelling, exploration teams can generate a clearer, more complete picture of subsurface potential. This enables better risk quantification, more targeted data acquisition, and improved exploration decision-making.

Download the full pdf below.


Exploration Team Consolidates Regional Maps

Regional Mapping of Key Reservoir Horizons

A regional exploration team at a large NOC needed to map key reservoir horizons across four producing oil fields, that while geographically adjacent to each other, were for a period of more than 30 years developed separately, where there was no exchange of knowledge between the separate Asset Teams.

A small team of Petrosys Group consultants were deployed on rotation to install PRO software, to establish the data exchange links to third party applications, and to develop the workflows to build the regional maps for seven key horizons.

Drawing on the final TWT interpretation and the Velocity data from each of the four Assets, intuitive and interactive workflows were built to generate each Assets well-tied depth horizons and regionally merged and well-tied depth horizons.

In addition to creating the regional maps for the seven merged and well-tied depth horizons the project delivered:

  • a documented workflow ensuring the repeatability as new interpretation became available
  • the optional delivery of the product depth grids back into the preferred interpretation solution
  • knowledge transfer in both domain expertise and future workflow configuration

The value of the Petrosys Group Consultant on this project was:

  • domain expertise delivering results quickly by addressing the identified technical challenges
  • a complete catalogue of maps for the seven key events, with the capability to reproduce and update them at any time
  • staff were able to focus on their areas of expertise but able to adapt and incorporate new best practices for when it was required again

The challenge:

Map key reservoir horizons from multiple oil fields all operated by different teams with consistency.

The Technical Objectives:

  • Install and configure an advanced mapping tool (PRO) to connect directly to data across 4 asset teams
  • Connect to seismic and well interpretation where available (TWT, Vav, Depth) for 7 reservoir zones across the 4 asset teams
  • Create TWT maps, Vav maps, depth convert surfaces, tie to well data, and analyse correction/QC maps
  • Adjust models as necessary and re-run
  • Merge all maps into a regional model

The Deliverables:

  • 175 maps
  • Report and presentation documenting the process and the results
  • Re-usable workflow which can be re-run as interpretation is updated
  • Training on the software and the workflow

Company Converts Legacy Data To Digital Formats

Quickly Convert Legacy Data to Digital Formats

A new entrant to a mature basin needed to gather surface and fault data from many images and scanned maps. Traditional digitising was slow, boring, and unpopular with the team, but attempts to outsource it had resulted in error prone data being returned. Useful knowledge was being excluded because it was too difficult to capture. It was clear they needed a way to quickly convert their legacy data.

PRO has tools to georeference images; convert rasters to grids; automatically trace lines; edit grid and vector data. Geoscientists can quickly convert images without getting repetitive strain and own their data making any necessary edits to produce high quality results that match their expectation and knowledge.

The Challenge

Traditional digitising is time consuming and laborious – took over 3 hours


The Solution

Using PRO –  converted and QC’d geoscience data in 25 minutes


The Result

PRO writes data directly back to interpretation systems for further modeling


Fast. Accurate. Relevant.

With a fast and accurate process, much more relevant data is available for assessment. The outputs are properly positioned in all dimensions and are easily shared with geoscience and GIS software, adding context and value to recent interpretation.

“We used to make do with using images as background pictures, but being able to properly incorporate surfaces or contours with z-values has changed the way we work.” TF, Geoscience Data Coordinator

Improving Accuracy of Subsurface Maps

Improve the Geological Accuracy of your Subsurface Maps

A new venture exploration team needed to map prospects in a highly faulted area. They knew the faults were present in their area of interest, but some were not being picked up by auto-tracking software – it became clear that to get what they wanted they would have to improve the geological accuracy of the subsurface maps. The exploration team ran PRO to generate a subsurface grid based on a 3D seismic surface and fault sticks, then took advantage of the advanced grid editing tools to reinterpret a fault zone based on their specialist understanding of the area.

Many gridding operations provide a mathematical solution to a geological problem. We have ways of modeling trends and bias using geostatistical methods, yet the quality of a subsurface map is only as good as the input data.

Poor or incomplete datasets can lead to the creation of unrealistic surfaces, which can lead to poor economic decisions.

The Challenge


Due to missing input data, the resultant fault polygon has been terminated at its heave maxima. The adjacent contours highlight that this is unrealistic and the isolated fault should be extended to merge with the major N-S trending fault as a splay


The Solution


In PRO, users have access to advance and easy-to-use grid editing tools, which allow them to edit the faults and contours embedded within a 3D surface. Any edits are then used to control a localised re-grid of the 3D structure and fault network.


The Result


3D grid of the top reservoir showing the fault network before (top) and after (base) the geoscientist has reinterpreted the fault network


Geological Accuracy

The grid editing process allows the geoscientist to correct for geological inaccuracies and manipulate a surface where input data is missing. The tools provide a fast and effective way of generating a structurally-sound model, which has implications for hydrocarbon storage and compartmentalisation.

“I’ve just come out of an internal peer review and the reinterpretation of our maps have led to identification of two more prospects.”

Geoscientist, Oil Company”